This guide walks through the math that fixes that, with one formula, one weighing process, and a short list of spices most kitchens already use every shift to improve consistency and manage dry spice yields more accurately.
TL;DR Quick Answers
dry spice yields
Dry spice yields measure how much usable spice survives after processing. The percentage represents purchased weight that actually makes it into the recipe after toasting, grinding, or sifting. A 454-gram bag of whole cumin that yields 392 grams of usable ground cumin has a dry yield of 86.3 percent. That gap is real cost, and most kitchens never price it in.
The formula:
Dry yield percentage = Post-processing weight ÷ As-purchased weight × 100
Adjusted cost per usable gram = Total purchase price ÷ Post-processing weight
Quick note: "Dry spice yields" can also refer to volume-to-weight conversions like teaspoons per gram, which vary by spice density. That's a separate calculation from processing yield. Use whichever one matches the math in front of you.
Top Takeaways
Five things to walk away with.
Dry spice yield is the usable weight remaining after a whole or unground spice gets processed. Toasting, grinding, and sifting all change the math.
Costing without yield understates true cost per serving on every spiced dish on the menu.
A standardized yield assumption per spice removes guesswork during menu engineering.
Recording actual yield across three to five batches gives a kitchen its own house data set, which beats published averages every time.
A spice is, by the working definition on Wikipedia, a seed, fruit, root, bark, or other plant substance primarily used for flavoring or coloring food. That botanical variety is exactly why yield varies so much from spice to spice.
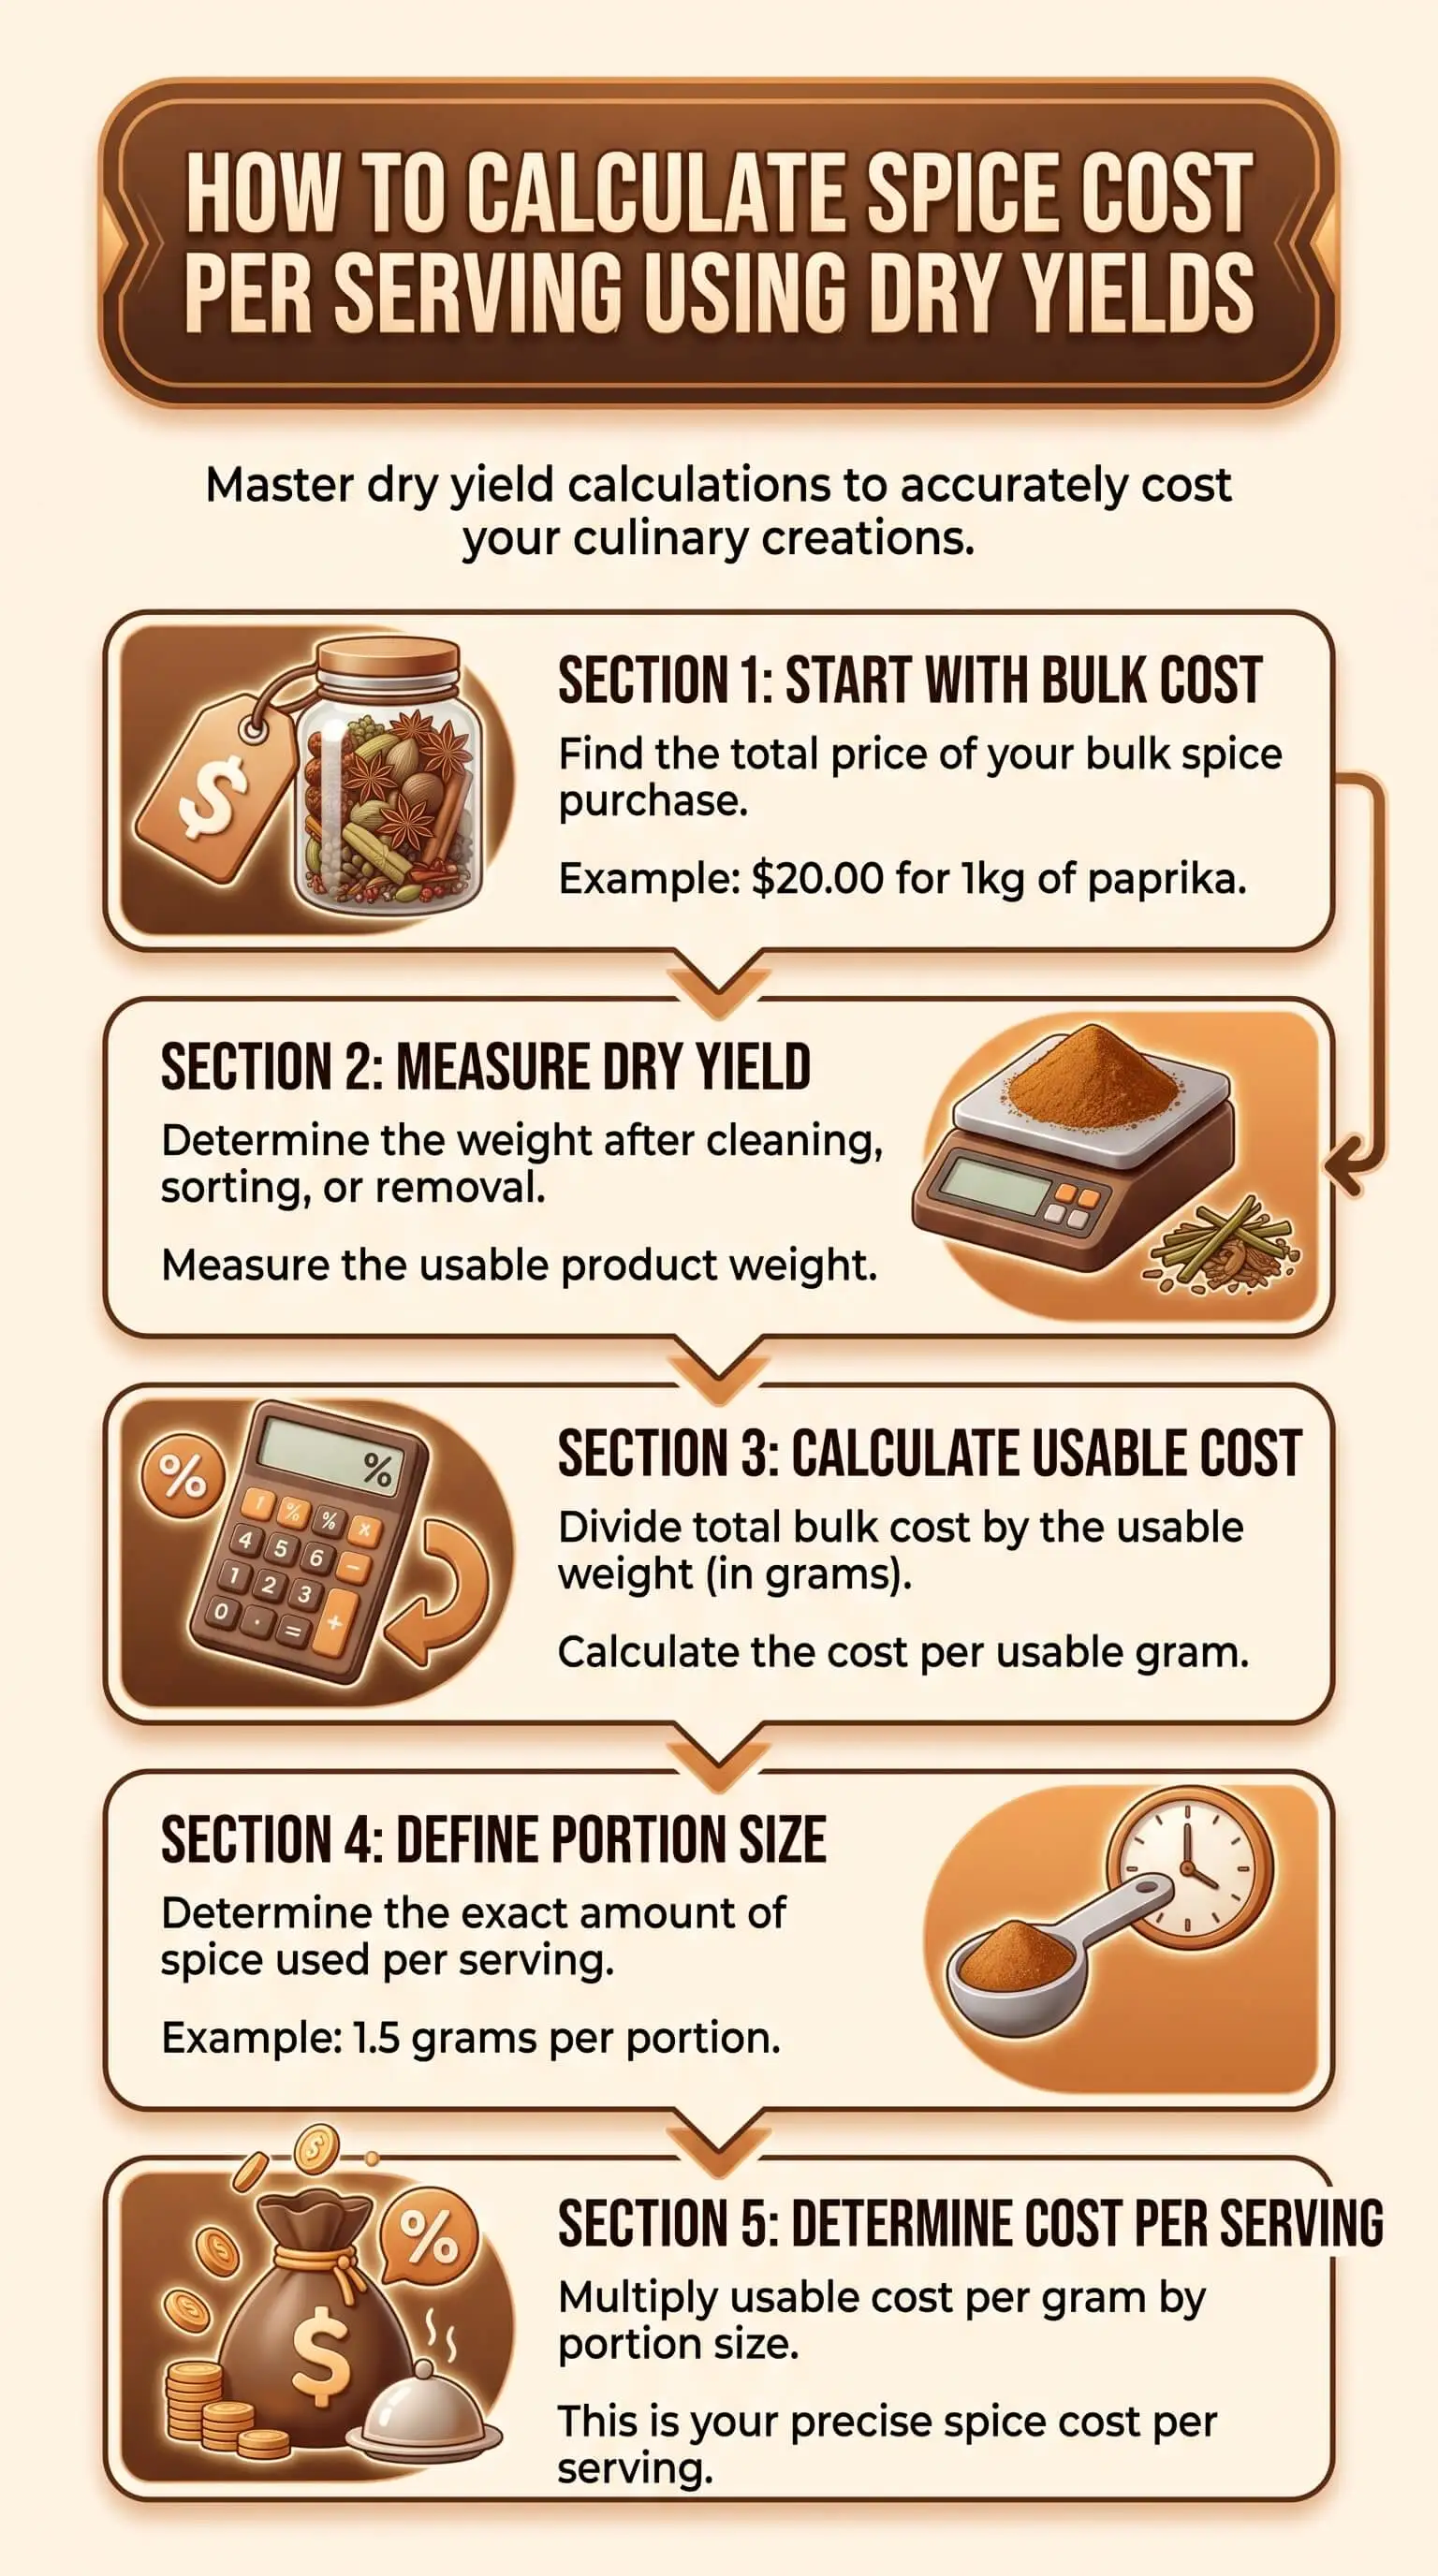
Four steps get a kitchen from invoice price to true cost per serving. None are complicated. The third one is where most of the money actually shows up.
Step 1: Record The As-Purchased Weight And Price For Each Spice
Every spice in the walk-in has two numbers worth knowing. What you paid for it, and how much of it you actually got. Pull the invoice or the bulk container label, and write down gross weight in grams or ounces next to total price. Use grams whenever the supplier will give you a metric weight, because the math runs cleaner and conversion errors get smaller. A one-pound bag of whole cumin seed at $14 gives you 454 grams at roughly 3 cents per gram on paper. That number changes the second the seed hits a toaster or a grinder.
Step 2: Measure The Post-Processing Weight
This is the step almost everybody skips. Weigh the spice again after every processing step you actually perform: after toasting, after grinding, after sifting. Spices lose mass to volatilization, husk removal, and equipment loss in ways that aren't intuitive at all. Whole black peppercorns can lose roughly 5 to 10 percent [VERIFY] of their weight once cracked and sifted, depending on how aggressively the chaff comes off. Whole cumin seed can lose 8 to 15 percent [VERIFY] when toasted and then ground. Those losses are real cost, and they belong somewhere in the math.
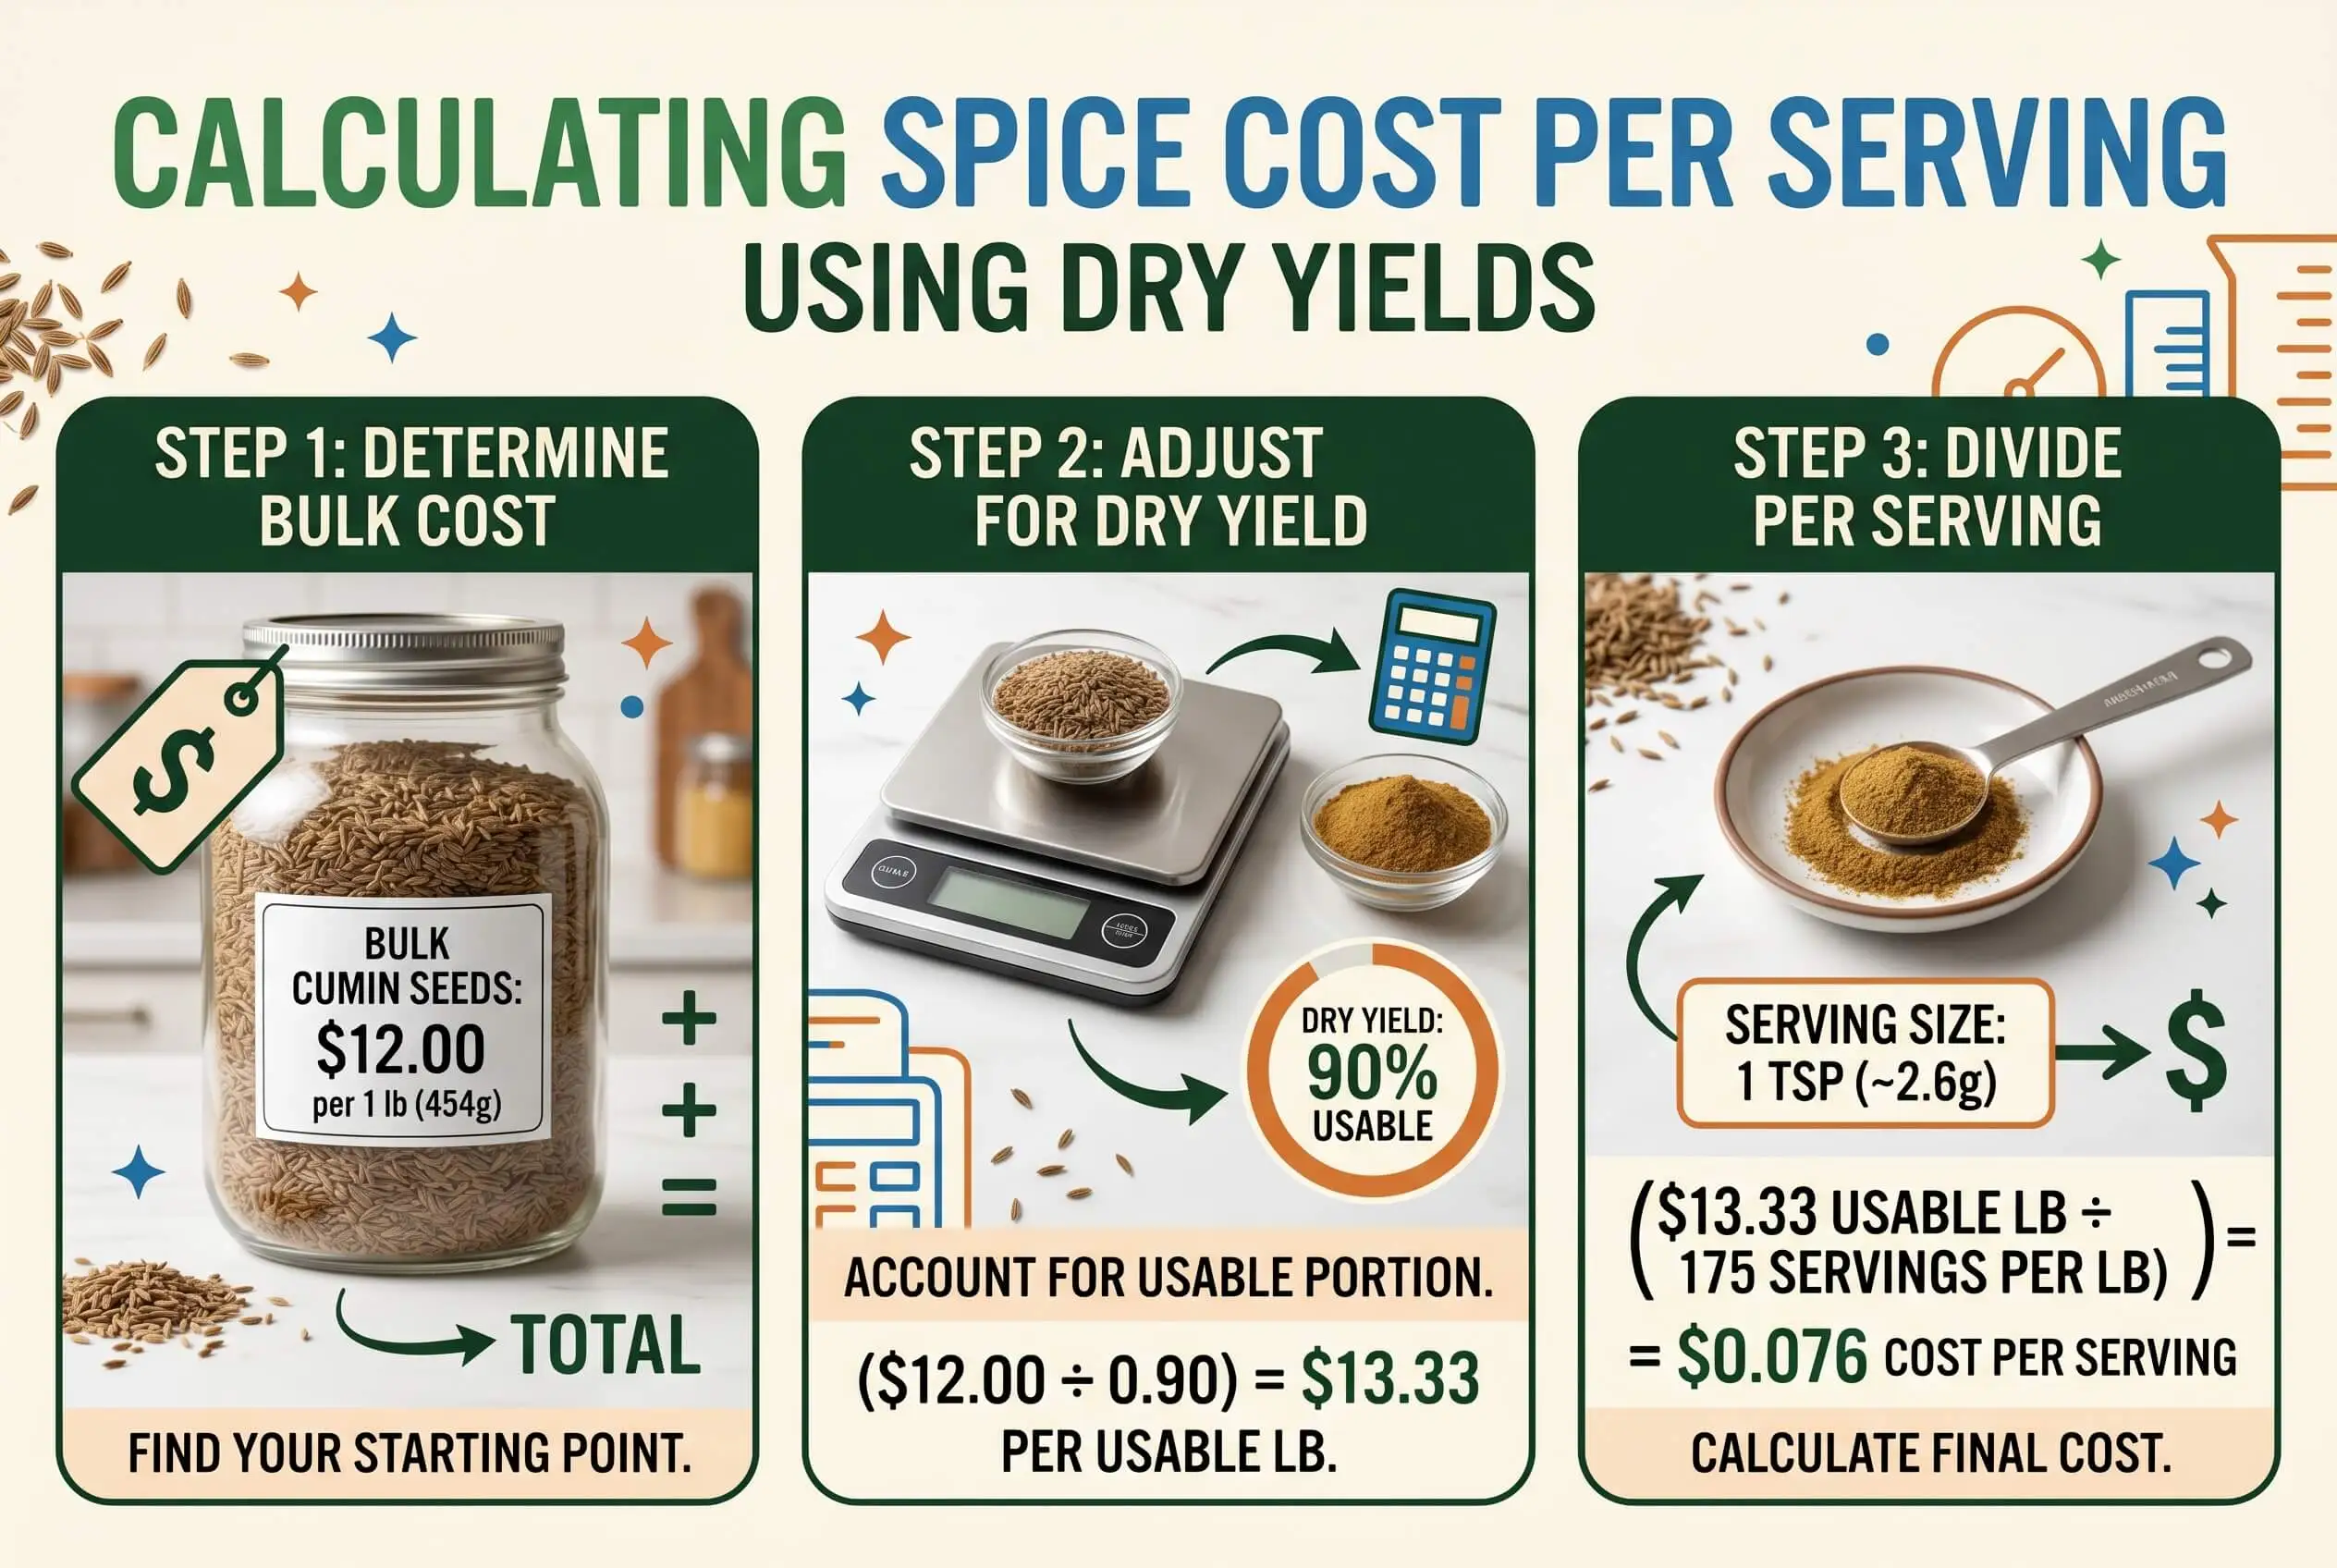
Step 3: Calculate Dry Yield Percentage And Adjusted Unit Cost
Dry yield percentage is the easiest part of the whole process. Divide post-processing weight by as-purchased weight, then multiply by 100. Start with 454 grams of whole cumin, end up with 392 grams of usable ground cumin, and the yield works out to 86.3 percent.
Adjusted cost per usable gram needs the same inputs flipped slightly. Divide the original total price by the post-processing weight instead of the as-purchased weight. That $14 bag of cumin doesn't cost 3 cents per gram anymore. It costs about 3.6 cents per gram of actually usable spice. That's a 17 percent unit-cost difference that gets quietly absorbed on every spiced dish in the book.
Step 4: Apply The Recipe Use Weight And Divide By Servings
Per-serving math gets honest in this step. Take the recipe weight of the spice in the dish, multiply by adjusted cost per gram, and divide by the number of servings the recipe actually produces. A 12-serving lamb shawarma that uses 24 grams of ground cumin runs about 87 cents in cumin alone, or 7.2 cents per serving. Run the exercise on every spice in the dish. Add the result to the protein, produce, and dairy costs already tracked on the recipe card. Now the kitchen has a true cost per serving instead of an estimated one.
“The kitchens I see protecting margin best are the ones that started measuring something they used to guess at. Once a chef sees that ground turmeric is costing 22 percent more per usable gram than the invoice price suggests, the menu pricing conversation gets a lot easier, especially for operators transitioning from Owning а smаll farm into commercial kitchen production where ingredient efficiency matters at every stage.”
7 Essential Resources
Seven references worth bookmarking if spice costing has just become a real line item in your operation. Five are external industry sources. Two are internal companion guides from this site.
USDA FoodData Central. The federal database of nutritional and weight data for thousands of foods, including most common spices. Useful when you need a standardized weight reference. https://fdc.nal.usda.gov/
American Spice Trade Association (ASTA). The trade body for the U.S. spice industry. Strong source for food safety guidance, technical standards, and broader industry context. https://astaspice.org/
National Restaurant Association Education and Resources. Operator-focused content on cost management, menu engineering, and operational efficiency. https://restaurant.org/education-and-resources/
USDA Food Loss and Waste. Federal data on food waste at the retail and consumer levels, plus practical guidance for cutting it across the supply chain. https://www.usda.gov/about-food/food-safety/food-loss-and-waste
The Culinary Pro: Calculating Food Cost. A well-organized walkthrough of food cost math written for working chefs and culinary students. https://www.theculinarypro.com/calculating-food-cost
How To Calculate Food Cost Percentage For Each Dish In Excel. Our companion guide on building per-dish food cost percentages in a spreadsheet. Pairs directly with the formula above. https://www.blackownedfarm.net/how-to-calculate-food-cost-percentage-for-each-dish-in-excel
Restaurant Kitchen Workflow Management For Small Spaces. The operational side of cost control. Process discipline drives cost discipline, especially in a tight footprint. https://www.blackownedfarm.net/restaurant-kitchen-workflow-management-for-small-spaces
3 Statistics
Three numbers worth keeping on the wall near the spice rack.
The U.S. restaurant industry loses an estimated $161 billion annually to food waste at the retail and consumer levels, equal to roughly 31 percent of the food supply. Source: USDA Food Waste FAQs.
The current full-service restaurant industry average food cost sits at 32.4 percent of revenue, with the long-standing healthy range pegged at 28 to 35 percent. Source: Whipplewood Restaurant Financial Benchmarks 2026.
Restaurants and food service operations waste an average of 4 to 10 percent of the food they purchase, driven mostly by overproduction, spoilage, and plate waste. Source: Market.us Food Waste Statistics.
Each number points back to the same operational fact. Kitchens that measure cost at the ingredient level lose less to waste, hold tighter food cost percentages, and protect margin that the estimating kitchens leave on the floor every shift.
Final Thoughts and Opinion
Most kitchens undercost their spices because of one quiet assumption. The numbers feel too small to matter to the food cost report. Pull the math forward and that assumption falls apart fast. Line items that look like rounding errors on an invoice add up to real money on a busy Saturday night. A 1.5 percent food cost overrun on a $50,000 weekly food spend works out to $750 a week. That's a payroll line that doesn't get run, a piece of equipment that doesn't get replaced, an investment in your line cooks that doesn't happen.
Dry yield costing is the work that should have always been built into the recipe card. Run it once for the top 10 spices on the line, and the resulting reference set, especially when organized into a simple spice yield conversion chart, pays for itself inside a month. Every recipe revision after that benefits from the same data set. The operators I've watched build this habit stop talking about food cost in the abstract. They talk about it ingredient by ingredient, and the margins follow.
Frequently Asked Questions
What is a dry spice yield, in simple terms?
Dry spice yield is the percentage of a spice's purchased weight that survives processing. Buy 100 grams of whole spice, end up with 88 grams of usable ground spice after toasting, grinding, and sifting, and the dry yield is 88 percent. That number determines true per-gram cost, which is almost always higher than the invoice price suggests.
How do I calculate spice cost per serving?
Take the purchase price, divide by post-processing weight to get adjusted cost per gram, multiply by recipe use weight, and divide by the number of servings the recipe produces. The formula stays the same for every spice. Apply it to all the spices in a single dish and add them together to get the dish's total spice cost per serving.
Why is my spice cost higher than my recipe assumes?
Almost always because the recipe is using as-purchased cost instead of usable cost. Processing loss can run anywhere from 5 to 15 percent [VERIFY] depending on the spice and the technique, and that loss has to be priced in. If a kitchen has never measured it, the loss has been absorbed as silent shrink.
How much weight do whole spices lose when ground?
It depends on the spice. Black peppercorns typically lose 5 to 10 percent [VERIFY]. Whole cumin seed can lose 8 to 15 percent [VERIFY] when toasted and then ground. Coriander, fennel, and mustard seed fall in similar ranges [VERIFY]. Measure your own to be sure, because supplier quality and grinder type both change the numbers.
Should I use fresh-to-dry conversion, volume-to-weight conversion, or dry yield for costing?
All three are different calculations and a busy kitchen ends up using all of them. Fresh-to-dry conversion handles the ratio between fresh and dried versions of the same herb (think fresh thyme versus dried thyme). Volume-to-weight conversion handles how many teaspoons of a spice fit into one gram or one ounce, which varies by spice density. Dry yield handles the loss between whole dried spice and the usable processed form. Use whichever applies to the math in front of you, and keep the three calculations straight on the recipe card.
How often should I re-measure my spice yields?
Once a year for the top 10 spices is a reasonable baseline. Re-measure sooner after a supplier change, a switch from whole to pre-ground or back, or a change in grinding equipment. Any of those variables can shift yield by several percentage points.
What is a reasonable target food cost percentage for a spiced dish?
Most full-service operators target somewhere between 28 and 35 percent across the menu, with individual dishes ranging from about 20 to 40 percent. Heavily spiced dishes often run higher than operators expect once dry yield gets factored in, which is exactly why per-dish costing matters.
Where do I record my house yield data?
A simple spreadsheet works. Columns for spice name, supplier, purchase price, as-purchased weight, post-processing weight, yield percentage, and adjusted cost per gram cover everything you need. Update it after every re-measurement or supplier change.
Call To Action
Pick one dish on the menu this week. The one that sells the most, or the one you suspect is underperforming on margin. Run the dry yield formula on every spice in the recipe. Compare the new per-serving cost against what the recipe card currently shows. If the gap surprises you, the leak just made itself visible. Run the next dish after that, then the next.
The operators who get spice costing right tend to share one habit. They've already measured what most kitchens are still guessing at. Start with the top 10 spices on the line, build the house data set in a spreadsheet or food recipe costing template, and let the numbers tell you which dishes to reprice and which to leave alone. The margin reflects it inside the first month.