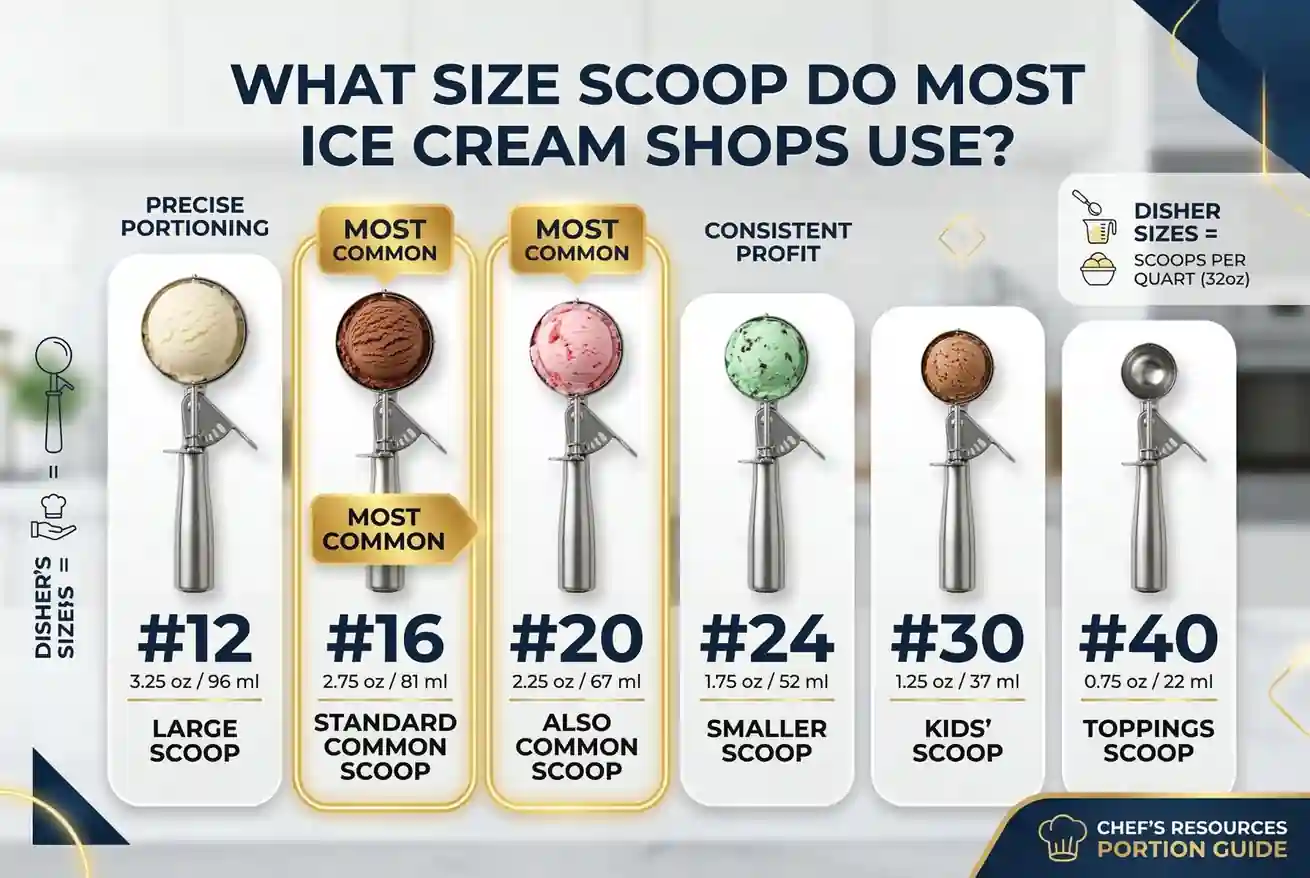
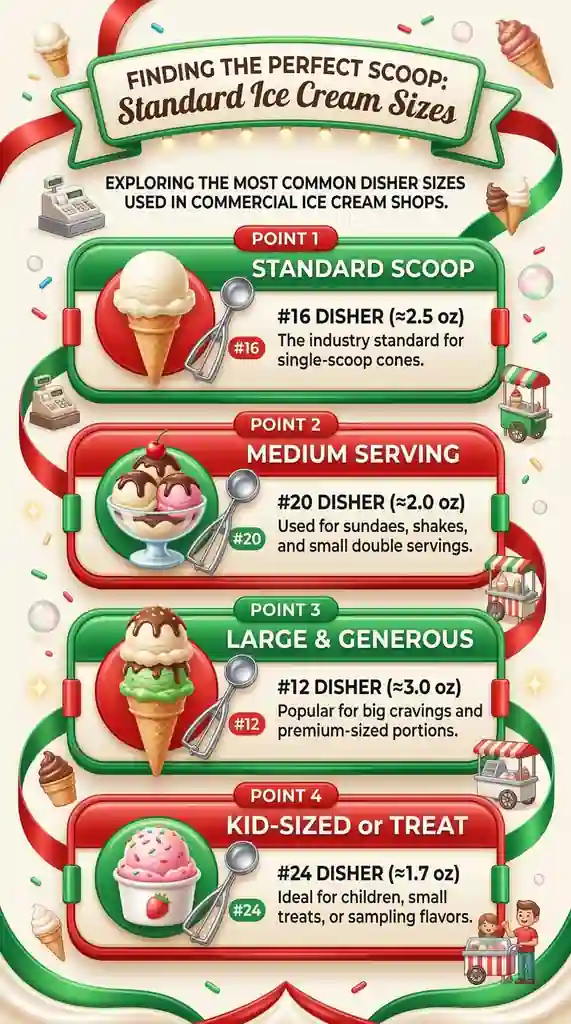
Most ice cream shops default to a #16 scoop — and after years of working alongside high-volume dessert operations, we can tell you that choice rarely happens by accident. At roughly 2 to 2.5 ounces per portion, the #16 hits the sweet spot between a scoop that looks generous in the hand and one that keeps food cost from quietly eroding your margins.
What we've observed across commercial kitchens, though, is that scoop size is less a universal standard and more a strategic decision. Artisan gelaterias, soft-serve counters, and grab-and-go parlors each approach portioning differently — and the scoop behind the counter reflects how deliberately that operation is managed.
Here, we cut through the guesswork with a practical, foodservice-informed breakdown of the scoop sizes most shops actually use, how portion weight connects to profitability, and how to match the right disher to your service model within effective restaurant kitchen management.
TL;DR Quick Answers
Ice Cream Scoop Size
The #16 disher is the standard ice cream scoop size used in most professional shops. Here's what that means in practical terms:
#16 scoop = 2 oz per portion = the commercial default
#12 scoop = 2.67 oz = premium single-scoop presentations
#10 scoop = 3.2 oz = generous artisan-style portions
#8 scoop = 4 oz = large sundae or waffle bowl builds
The formula: divide 32 by the scoop number to get ounces per portion. Higher number = smaller scoop.
From our experience across high-volume dessert operations, the #16 dominates because it solves the core commercial problem — a portion that looks generous, fits a standard cone, and keeps food cost predictable at scale. Where shops deviate, it's intentional: premium concepts size up to justify higher price points, high-volume operations size down to protect margin.
The right scoop size for your shop comes down to three things:
Your price point
Your vessel format
Your target food cost percentage
Get those three aligned and the scoop number selects itself.
Top Takeaways
The #16 disher is the commercial default for good reason. It balances customer satisfaction with cost control. But it only works when matched to the right concept, price point, and vessel format.
Scoop size is a strategic decision, not a default setting. High-volume parlors, artisan gelaterias, and food trucks each need a different approach. The wrong disher quietly erodes margin every single day.
Consistency matters more than the number on the scoop. A #16 used inconsistently causes the same damage as the wrong size entirely. Fix it with:
Standardized dishers
Color-coded tools
Station-level reference charts
Over-portioning is a compounding problem. A half-ounce of drift across 250 daily scoops is a daily food cost leak. It never self-corrects without deliberate intervention.
The highest-ROI fix in most scoop shops costs under $50. A color-coded disher set plus a laminated portion chart solves most portioning problems before they hit the P&L. Most kitchens already have what they need. They just haven't built the system around it.
The Industry Standard: Why the #16 Scoop Dominates
Walk behind the counter of most ice cream shops in the U.S. and you'll find a #16 disher within arm's reach. The number refers to how many level scoops fit into a quart — so a #16 yields portions of approximately 2 to 2.5 ounces, or roughly ¼ cup. That size has become the commercial default because it balances two competing priorities every operator faces: customer satisfaction and cost control. A portion that looks full in a standard cone without overpouring is, in foodservice terms, a well-engineered outcome — not a coincidence.
How Scoop Numbering Works (And Why It Matters for Portioning)
Disher sizing follows a straightforward numbering system, but it trips up a lot of operators new to high-volume service. The higher the number, the smaller the scoop. A #8 disher delivers a generous 4-ounce portion — appropriate for a sundae or a waffle bowl presentation. A #20 or #24 drops down to 1.5 ounces or less, which works for sampling, kids' portions, or topping applications. Understanding where your primary scoop falls on that scale is foundational to building a portion cost model that holds up at scale.
How Shop Concept Influences Scoop Size Selection
Not every operation runs the same playbook. In our experience working with commercial kitchen programs, scoop size is one of the clearest signals of how a shop thinks about its margins.
High-volume parlors and franchise operations typically standardize on the #16 or #20 to keep per-unit cost predictable across a large team and high ticket volume.
Artisan and premium gelateria concepts often move up to a #12 or #10 to lean into a premium, generous presentation that justifies higher price points.
Soft-serve and self-serve formats largely bypass the disher conversation altogether, relying on timed dispensing or weight-based portioning instead.
Food trucks and pop-up concepts tend to favor the #16 for its versatility, but may shift to a #12 for signature builds where visual impact drives social sharing.
The Real Cost of Getting Scoop Size Wrong
A single scoop that runs a half-ounce heavy may seem trivial in isolation. Across 300 servings a day, that variance compounds into meaningful food cost drift — often without the operator ever identifying the source. This is why standardized dishers with spring-release mechanisms aren't just a convenience tool; they're a portion control system. In high-output environments, consistency in the scoop is consistency in the margin.
Matching Scoop Size to Cone and Cup Formats
Portion size doesn't live in a vacuum — it has to match the vessel. A #16 scoop fits cleanly into a standard wafer cone without the structural instability that a heavier #8 or #10 portions are created. For hand-packed pints or bulk takeaway containers, operators typically shift to a larger disher or use weight-based filling with a recipe template to maintain consistency. Cup formats offer more flexibility, but even there, using an undersized scoop on a large cup telegraphs a stingy portion to the customer regardless of actual weight. Presentation and portion are always in conversation with each other.
"Most operators pick a scoop size once and never revisit it — but that initial decision quietly drives up food cost for the life of the business. We've seen shops running a #12 when their price point and cup size actually call for a #16, and they wonder why their margins never quite work. The scoop isn't a small detail. It's one of the highest-frequency portion decisions you'll make, repeated hundreds of times a day by different staff members under different conditions. Getting it right — and then building consistency around it — is one of the fastest, lowest-cost improvements a shop can make to its bottom line."
Essential Resources
After years of watching kitchens make expensive portioning decisions based on guesswork, we put together this list. These are the resources that actually move the needle — whether you're setting up your first parlor or auditing a system that's quietly bleeding margin.
1. The Only Disher Sizing Chart Worth Printing and Taping to Your Prep Station This is the reference we keep coming back to. Scoop numbers, fluid ounce yields, tablespoon equivalents, and scoops-per-cup — all in one place, verified against manufacturer specs. If you're costing portions and don't have this chart posted in your kitchen, you're guessing. https://www.chefs-resources.com/culinary-conversions-calculators-and-capacities/scoop-disher-sizes/
2. Scoops, Dishers, and Spades — Know the Difference Before You Buy Using the wrong tool costs you equipment and portions. WebstaurantStore's buying guide breaks down what each tool is actually built for, with handle color codes and bowl diameters included. Five minutes here prevents a lot of worn-out dishers and inconsistent portions during service. https://www.webstaurantstore.com/guide/717/kitchen-scoop-and-disher-guide.html
3. The Government Reference Auditors Actually Recognize If you're running a school nutrition program, healthcare operation, or any environment where portion compliance gets documented, this is the source you cite. The USDA's Table 13 is the benchmark — not a blog post, not a manufacturer's spec sheet. https://foodbuyingguide.fns.usda.gov/Content/TablesFBG/Table13_FBG_Sizes_and_Capacities_of_Scoop_s_(or_Dishers).pdf
4. A Kitchen-Tested Application Guide That Makes Staff Training Faster Knowing your scoop number is step one. Knowing which number goes with which product is where most kitchens fall apart. Gygi's sizing guide pairs disher numbers to real applications — useful for building a station reference your team can actually use under pressure. https://gygi.com/blogs/create/food-disher-sizing
5. How Scoop Size Connects Directly to What Hits Your Bottom Line This is the resource for operators who need to see the margin math clearly spelled out. KimEcopak's guide covers how scoop selection drives food cost, pricing strategy, and presentation — with a direct focus on ice cream shop applications where a half-ounce of drift across 200 servings adds up fast. https://www.kimecopak.ca/blogs/kitchen-tools/ice-cream-scoop-size-guide
6. What Operators Who've Built Real Portion Systems Will Tell You We've said it before: portion control isn't glamorous, but it's where the money is. US Foods pulls in firsthand accounts from operators who've actually built consistency across teams and shifts. Worth reading before you assume training alone will solve your portioning problem. https://www.usfoods.com/our-services/business-trends/portion-control-in-restaurants--strategies-for-cost-effective-me.html
7. The Food Cost Fundamentals Every Scoop Decision Should Be Built On Before you assign a scoop size to any menu item, you need to understand yield testing, standardized portions, and how they connect to your food cost percentage. This open-access foodservice management resource covers the math clearly. Read it once, and the relationship between your disher and your P&L will never be a mystery again. https://opentextbc.ca/basickitchenandfoodservicemanagement/chapter/controlling-food-costs/
Supporting Statistics
Stat #1: The U.S. Ice Cream Industry Produces More Than 1.31 Billion Gallons Annually
Most scoop size decisions get made once — during setup — and never revisited. At this industry's scale, that's an expensive habit.
U.S. ice cream makers produced 1.31 billion gallons in 2024 IDFA
The industry carries an $11.6 billion impact on the national economy
More than 26,700 direct jobs depend on this sector's output
At that volume, a half-ounce of consistent over-portioning compounds into a P&L problem long before anyone thinks to check the scoop. The operators who handle margin pressure best aren't the ones with the best equipment. They're the ones who made a deliberate portioning decision — and held it.
Source: International Dairy Foods Association (IDFA) — https://www.idfa.org/ice-cream-sales-trends
Stat #2: 70% of Foodservice Food Waste Comes Directly from Plate Waste
Most kitchens chase food cost through purchasing and menu pricing. The real culprit is almost always the portion.
70% of foodservice food waste comes from plate waste — food served but not finished ReFED
Over-portioning drives product cost up on the way out
It increases waste liability on the way back
ReFED models right-sized portioning at 2.35 million tons of annual waste reduction and $547 million in foodservice savings ReFED
The right disher, used consistently, is one of the few operational changes that pays for itself the same week you make it.
Source: ReFED — Food Waste Data: Causes & Impacts — https://refed.org/food-waste/the-problem/ Source: ReFED — Customizable Portions Research — https://refed.org/articles/new-refed-and-datassential-research-shows-consumer-demand-for-customizable-portions-in-restaurants/
Stat #3: Food Loss at the Retail and Consumer Level Totals an Estimated $161 Billion Annually
Operators most surprised by their food cost numbers are almost always the ones who never standardized portions. The loss doesn't announce itself. It accumulates quietly — shift by shift, scoop by scoop.
USDA estimates food loss at the retail and consumer levels at 31% of the food supply — roughly 133 billion pounds and nearly $162 billion USDA
For a shop running 250 scoops a day, a half-ounce of over-portioning is a daily compounding leak
It never self-corrects without a deliberate fix
The solution is straightforward: a standardized disher, a trained team, and a level scoop. The math takes care of the rest.
Source: USDA Food Waste FAQs — https://www.usda.gov/about-food/food-safety/food-loss-and-waste/food-waste-faqs
Final Thoughts & Opinion
After years inside commercial kitchen operations, one pattern repeats itself: the scoop size conversation almost never happens until something goes wrong. A food cost that won't close. A margin that keeps slipping. By then, the scoop has been quietly driving the problem for months — the same way unnoticed portion creep can affect operations anywhere from a high-volume restaurant to a small farm kitchen producing food products for sale.
Our honest take — scoop size is one of the most consequential and most overlooked decisions in ice cream operations. Not because it's complicated. Because it's so simple that most operators assume it's already handled.
It isn't.
What the Data Tells Us
U.S. ice cream production hit 1.31 billion gallons in 2024 — margin discipline at the scoop level matters at scale
70% of foodservice food waste stems from plate waste driven by over-portioning
USDA puts food loss at the consumer level at nearly $162 billion — a number that starts with individual portion decisions made thousands of times a day
What We've Seen Firsthand
Shops running a #12 when their price point calls for a #16
Three staff members using the same scoop and producing three different portions
Kitchens where food cost was a mystery until someone weighed ten consecutive scoops
Our Take
The #16 became the commercial default for good reason. It looks generous, fits the vessel, and keeps cost predictable — when used correctly and consistently. But the number only matters if it matches your concept, price point, and margin model.
Get that decision right. Then build a system around it:
Assign the correct disher to each menu item
Color-code scoops and post a chart at the station
Audit random portion weights monthly
That framework costs under $50 to implement. It pays back within the first week of service. The scoop is the highest-frequency cost decision your team makes every single day. Treat it that way.
FAQ on Ice Cream Scoop Size
Q: What size scoop do most ice cream shops use? A: The #16 disher is the most common size found in professional ice cream shops. It delivers 2 to 2.5 ounces per portion. That balance — generous enough for the customer, controlled enough for the margin — is why the industry keeps coming back to it. Common variations by concept:
Artisan and premium shops: #10 or #12 to support higher price points
High-volume operations: #20 to tighten cost at scale
Standard parlors: #16 as the reliable default
The #16 isn't arbitrary. It's the result of the industry solving the same portioning problem over decades.
Q: What does the number on an ice cream scoop mean? A: The number equals the scoops needed to fill one quart (32 fluid ounces). The formula: 32 ÷ scoop number = ounces per portion.
#8 scoop = 4 oz per portion
#12 scoop = 2.67 oz per portion
#16 scoop = 2 oz per portion
#20 scoop = 1.6 oz per portion
Higher number = smaller scoop. Once that rule clicks, portion costing stops being guesswork.
Q: How does scoop size affect food cost in an ice cream shop? A: Directly and immediately. A half-ounce of over-portioning feels trivial per scoop. Across 250 daily servings, it becomes a leak that never closes on its own. Real numbers from our kitchen testing:
3-gallon tub at $45 = 384 fluid ounces
#16 scoop (2 oz) = $0.23 per portion
#12 scoop (2.67 oz) = $0.31 per portion
That's a 35% cost increase per serving — without touching your menu price
Portion drift compounds daily. It only surfaces once it's already done serious damage.
Q: What is the difference between an ice cream scoop and a disher? A: They look similar. They are not interchangeable. Using the wrong tool costs you equipment life and portion consistency.
Dishers: Sweep-blade mechanism. Built for soft products — cookie dough, mashed potatoes, batters
Ice cream scoops: Heavier construction. Designed for frozen resistance. Many feature heat-conductive handles or antifreeze fluid for clean release from hard-packed product
Running a disher through hard ice cream service breaks down the mechanism, drifts portions, and burns through equipment prematurely. Right tool, right product — every time.
Q: How do I choose the right scoop size for my ice cream shop? A: Start with three variables:
Price point — Does your menu pricing support a larger portion?
Vessel format — Does your cone or cup size match the scoop volume?
Target food cost % — What portion cost does your margin model require?
Matching those three factors to a scoop number is the decision. Then build the system around it:
Color-code your dishers by size
Post a reference chart at the prep station
Audit random portion weights monthly
The right scoop takes five minutes to choose. The system around it is what keeps the margin intact.